
Angles is an open-source, centralised test dashboard. You store your automated test results and screenshots, and author and run your manual tests, in one place, through a clearly defined API. Because everything goes through that API, you aren’t tied to one framework or programming language. Every test automation framework you have can report to the same dashboard.
Contents
- Features
- Architecture
- Setting up Angles
- Configuration reference
- Authentication & user management
- Teams, components and environments
- Angles API
- Client libraries
- Visual testing
- Manual test management
- Monitoring with Prometheus & Grafana
- Angles clean-up (cron)
- Running Angles locally for development
Features
Automated test reporting
- Store builds (test runs), suites, test executions, actions and steps from any framework, together with:
- the team and component that ran the tests
- the environment they ran against
- the test phase (e.g. smoke, regression)
- artifact versions of the system under test
- platform details (platform, browser, device, screen size, etc.)
- Test attachments: console logs, network HAR files, videos, Playwright traces, page HTML snapshots and images, attached to a test or a single step and shown in the UI with a viewer for each
- Batch mode in the clients, which stores every test execution for a build in a single request
- Test execution history, which follows a single test case over time
- Test run comparison (a test matrix of multiple runs side by side)
- A downloadable HTML report for each build, which opens offline and has a light/dark toggle (it follows your OS until you choose, and remembers your choice)
- Who triggered each run: the user that created the build, and the name of the API token when it was reported with an API key (shown on the dashboard, the test run page and in the HTML report)
- A “keep” flag, so important builds survive the nightly clean-up
Visual testing
- Visual comparison against a configurable baseline, using one of three algorithms: pixel (pixelmatch), SSIM or perceptual hash (pHash)
- Letterboxed comparisons, so screenshots of different sizes compare without being stretched or distorted
- Diff regions (changed pixels clustered into bounding boxes)
- Ignore boxes (areas to exclude from a comparison)
- Dynamic baselines generated from the last n screenshots of a view
- Finding an image within a screenshot (multi-scale template matching, e.g. to check that a logo or button is displayed)
- A screenshot library you can search by view, tag, platform and period
- All CPU-heavy image work runs on a worker pool, so large comparisons never block the API
Manual test management (new in Angles 3.0, can be switched off)
- Versioned manual test cases with steps, expected results, preconditions, tags, priority and status
- Folder trees to organise test cases into suites, with drag-and-drop filing
- Re-usable shared steps
- Per-team custom fields
- Image attachments on steps and executions
- Manual test runs, which feed the same dashboards and metrics as automated runs
- A full change history for every test case and shared step
Dashboards & metrics
- A dashboard per team with build history and status charts
- Execution metrics grouped by result, phase and platform
- An automated / manual toggle on the dashboard and metrics pages
- An opt-in Prometheus
/metricsendpoint and a ready-to-import Grafana dashboard
Security & administration
- Sign-in is required, with three roles (admin, team lead and user) and per-team access
- Personal API tokens for CI pipelines and the client libraries
- Single sign-on through any number of OIDC, SAML 2.0 and LDAP / Active Directory providers, all configured from the admin UI
- Feature management (e.g. turning manual testing on or off) from the admin UI
User interface
- A Next.js + RSuite front-end with a global team picker
- 12 colour themes (light, dark, high-contrast and colour-blind-safe variants)
- Translations in English, Dutch, Thai, Chinese and Hindi
Operations
- Docker images for the back-end and the front-end, plus Docker Compose and Kubernetes manifests
- Automatic clean-up of builds and screenshots older than 90 days (configurable)
- Client libraries for JavaScript, Java and Python
Architecture
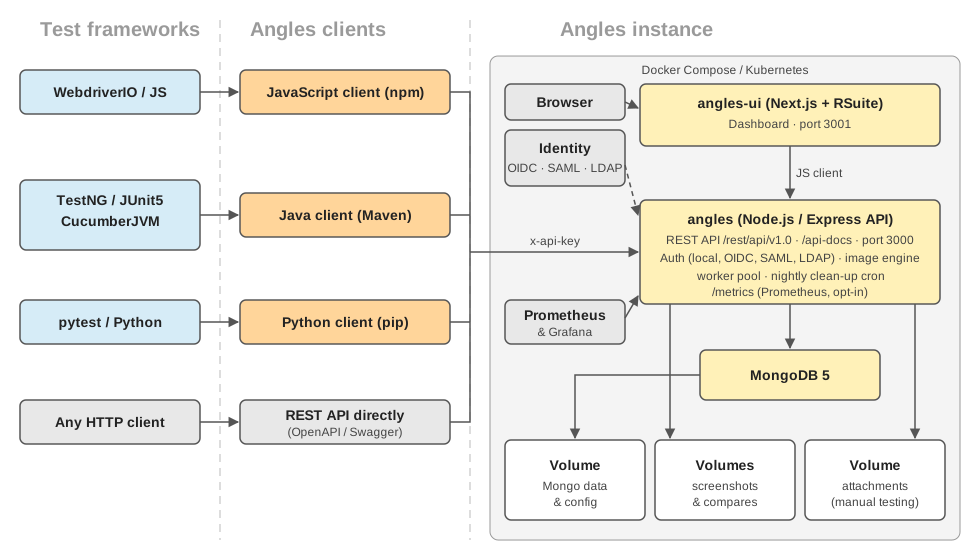 Image: The Angles architecture
An Angles instance consists of 3 containers:
- angles (back-end, Docker image angleshq/angles). A Node.js / Express service that serves the REST API on port 3000 under
/rest/api/v1.0, the interactive API documentation at/api-docsand, when enabled, the Prometheus endpoint at/metrics. It also handles authentication (sessions, API tokens and SSO), runs the image engine on a pool of worker threads, and runs the nightly clean-up cron. - angles-ui (front-end, Docker image angleshq/angles-ui). A Next.js (React) application built with the RSuite component library and served on port 3001. It talks to the back-end through the angles-javascript-client, the same client JavaScript test frameworks use.
- MongoDB (
mongo:5), which stores all the test data, users and settings.
Persistent data lives on Docker volumes (or a persistent volume claim on Kubernetes):
| Volume | Mounted at | Contains |
|---|---|---|
angles_mongo_db, angles_mongo_config |
/data/db, /data/configdb (mongo) |
The database |
angles_screenshots |
/app/screenshots (angles) |
Uploaded screenshots |
angles_screenshot_compares |
/app/compares (angles) |
Generated comparison images |
angles_attachments |
/app/attachments (angles) |
Manual testing attachments |
Test frameworks report into Angles through one of the client libraries, or by calling the REST API directly. Automated clients authenticate with a personal API token (the x-api-key header). Browser users authenticate with a session cookie, either through a local account or through an SSO identity provider.
Setting up Angles
With Docker Compose
To set up your own instance of Angles you can use the docker compose file with Docker Compose.
Clone the angles project, then in a terminal go to the setup folder. It contains the docker-compose.yml file and the mongo-init.js file, which creates the database user, collections and indexes the first time MongoDB starts.
Before you start the containers for the first time:
- Set ANGLES_ADMIN_PASSWORD. The initial admin account is created with this password (see Authentication & user management).
- If you aren’t running Angles locally (e.g. on 127.0.0.1), change ANGLES_API_BASE_URL for both the backend and frontend services to the URL where the Angles API can be reached (e.g. a domain name or external IP address). Also set ANGLES_BASE_URL to the public URL users reach Angles on.
- For anything other than a local trial, set SESSION_SECRET to a long random value.
# run in the same directory as the docker-compose file
docker compose pull && \
  ANGLES_ADMIN_PASSWORD='<your_admin_password>' SESSION_SECRET='<random_value>' \
  docker compose -f docker-compose.yml up -d
Once the containers are running:
- the dashboard is available at http://127.0.0.1:3001
- the API documentation is available at http://127.0.0.1:3000/api-docs
Tearing down Angles
To tear down the containers, run the following command in the directory that contains the docker-compose.yml file.
docker compose down
NOTE: Angles creates volumes to store persistent data (database, screenshots, comparisons and attachments). These volumes stay even after you run the command above. If you want to remove them too, you have to delete them manually (e.g. docker volume rm angles_mongo_db ...).
With Kubernetes manifests
If you’d rather run Angles on Kubernetes, the manifests are in the setup/kubernetes folder of the angles repo. They are numbered in the order they should be applied: namespace and storage, config, mongo, and finally the angles pods and services.
# run in the setup/kubernetes directory
kubectl apply -f .
As with the Docker Compose setup, review the config manifest first. Set the environment variables (e.g. ANGLES_API_BASE_URL, ANGLES_BASE_URL, ANGLES_ADMIN_PASSWORD and SESSION_SECRET) to match your environment.
Configuration reference
Back-end (angles)
| Variable | Default | Purpose |
|---|---|---|
PORT |
3000 |
Port the API listens on. |
MONGO_URL |
value in config/database.config.js |
MongoDB connection string. |
ANGLES_API_BASE_URL / ANGLES_API_BASE_PATH / SWAGGER_SCHEMES |
127.0.0.1:3000 / /rest/api/v1.0 / http |
Used to render the Swagger (/api-docs) server URL. |
ANGLES_BASE_URL |
http://localhost:3000 |
Public origin of the instance. Each SSO provider’s callback URL is derived from it. |
SESSION_SECRET |
random per process | Signs session cookies. Required when NODE_ENV=production. |
ANGLES_ADMIN_PASSWORD |
– | Seeds the initial admin account on first startup. |
ANGLES_ADMIN_USERNAME |
admin |
Username of the seeded admin account. |
SECURE_COOKIES |
false |
Set to true to mark the session cookie Secure when serving over HTTPS. |
TRUST_PROXY |
false |
Set to true when running behind a TLS-terminating reverse proxy. |
BUILD_CLEAN_UP_AGE_IN_DAYS |
90 |
Age after which the nightly clean-up removes builds. |
ANGLES_MANUAL_TESTING_ENABLED |
true |
Seed for the manual testing feature toggle (only used on first run). |
ANGLES_ATTACHMENT_MAX_SIZE_MB |
100 |
Largest file a test can attach (logs, HAR files, videos, traces, HTML snapshots). |
IMAGE_ENGINE_WORKERS |
1–2, based on CPU count | Size of the image engine worker pool. |
IMAGE_ENGINE_TASK_TIMEOUT_MS |
120000 |
Timeout for a single image task. |
ANGLES_METRICS_TOKEN / ANGLES_METRICS_PUBLIC |
unset | Enable the Prometheus endpoint (see Monitoring). |
LOG_LEVEL |
info |
Log level of the API’s (pino) logger. |
Front-end (angles-ui)
| Variable | Default | Purpose |
|---|---|---|
PORT |
3001 |
Port the UI is served on. |
ANGLES_API_BASE_URL |
http://127.0.0.1:3000 |
URL of the Angles API, as the user’s browser reaches it. |
ANGLES_API_BASE_PATH |
/rest/api/v1.0 |
Base path of the API. |
The UI reads these values when the container starts, not when the image is built. You can point the published image at any API without rebuilding it.
Authentication & user management
Every API request and every page in the UI requires an authenticated user.
The initial admin account
On first startup the back-end creates a single administrator account from these environment variables:
- ANGLES_ADMIN_PASSWORD: required. It must meet the password policy (10–100 characters, with at least one letter, one uppercase letter and one special character), otherwise no admin is created.
- ANGLES_ADMIN_USERNAME: optional, defaults to
admin.
NOTE: The account is only created if it doesn’t exist yet. After that the password is managed through the app (User Settings → Password), so changing the environment variable later has no effect. If you ever lock yourself out, the back-end repo includes scripts/create-admin.js <username> <password>, which creates an admin directly in the database.
When running in production (NODE_ENV=production) you must also set SESSION_SECRET, which signs the session cookies. Anyone who knows it can forge a session for any account, so generate a random value per deployment.
Roles and team access
Every user has one of three roles:
- admin: full access to every team, plus user management, authentication settings, feature management, custom fields, and creating or deleting teams and environments.
- team_lead: elevated access to the teams they belong to, e.g. editing team settings and components, managing the team’s members, deleting test cases and runs, and managing shared steps.
- user: standard access to the teams they belong to.
Users who aren’t admins can only see and report data for the teams they’ve been granted. Administrators manage users, roles and team membership from Administration → Users in the UI, where the table also shows when each user last signed in (local, LDAP or SSO sign-ins count; API-token requests do not).
Team members (team leads)
Team leads manage their own teams’ membership from Team Settings → Team Members: they can see who is in the team, add an existing user (a type-ahead finds users from three letters of their username or email address) and remove a user. The same is available over the API (GET/POST /team/{teamId}/members and DELETE /team/{teamId}/members/{userId}, session authentication only).
A team lead can add any user, whatever their role and however they sign in (local, LDAP or SSO, including accounts whose username is an email address), with two exceptions: the core admin account (the one seeded from ANGLES_ADMIN_USERNAME, admin by default) never appears in the search and cannot be added or removed by a team lead, and a team lead cannot remove themselves from a team they lead. A user’s membership of other teams is never affected.
API tokens
Interactive sign-in uses a session cookie. Automated clients (CI pipelines, and the Java, JavaScript and Python clients) authenticate with a personal API token instead. Generate a token from User Settings → API Tokens and send it on every request in the x-api-key header. The token is only shown once, when you create it, and you can revoke it at any time. Builds created with a token record the token’s owner and its name, so a run can always be traced back to the pipeline that reported it.
Single sign-on (OIDC, SAML 2.0 and LDAP)
Next to local password accounts, Angles supports any number of single sign-on providers. All provider configuration happens in the admin UI (Administration → Settings → Authentication). It is stored in the database and takes effect without a restart or redeploy. The only related deployment values are ANGLES_BASE_URL (used to derive the callback URLs), SESSION_SECRET, and SECURE_COOKIES / TRUST_PROXY when serving over HTTPS.
Each provider has an id (used in its URLs), a display name, a type and a set of role mappings. The groups a provider reports are matched (case-insensitively) against the mappings, and the user gets the strongest matching role (admin > team lead > user). If nothing matches, access is denied unless a default role is configured. A username that already belongs to a local account or to another provider is never taken over.
Provider secrets (OIDC client secrets, SAML private keys, LDAP bind credentials) are write-only. Once saved they can be replaced, but never read back.
- OIDC: works with any spec-compliant provider (Okta, Entra ID, Google Workspace, Keycloak, Auth0, Authentik, Ping, Cognito, GitLab). It uses the authorization code flow with PKCE, with endpoints discovered from the issuer. Register
{ANGLES_BASE_URL}/rest/api/v1.0/auth/sso/{id}/callbackas the redirect URI. Scopes and the groups claim are configurable, because providers differ: Entra ID emits group GUIDs, and Google emits no groups without Cloud Identity. - SAML 2.0: for ADFS, Shibboleth and any IdP that only offers SAML. Import the SP metadata from
{ANGLES_BASE_URL}/rest/api/v1.0/auth/sso/{id}/metadata. The IdP signing certificate is required, assertion signatures are always enforced, and IdP-initiated login is rejected unless you explicitly allow it. - LDAP / Active Directory: a direct bind with the user’s credentials. A plaintext
ldap://connection without StartTLS is refused, so useldaps://or enable StartTLS. Groups come from a group search or frommemberOf, and you map roles to group names (e.g.Angles Admins).
For a full walk-through of every option, see the authentication guide in the angles repo.
Teams, components and environments
Before you can store any test results you need to set up:
- a team (and its component(s))
- an environment.
NOTE: The team, component and environment must exist before you can add builds for that team, otherwise Angles returns an error when you try to store the results. Creating teams and environments requires an admin account. Once a team exists, its team leads can rename it and add components from the Team Settings page.
When you first open the dashboard without any teams, Angles shows a welcome page that links to the API documentation. To create the example team and environment used by the Java examples and the WebdriverIO example, use the API docs at http://127.0.0.1:3000/api-docs:
- Create a team (
POST /team)
{
  "name": "angles",
  "components": [
    {
      "name": "example"
    }
  ]
}
- Create an environment (
POST /environment)
{
  "name": "qa"
}
In the API docs, click Authorize and paste an API token generated by an admin. Then open the endpoint, click Try it out, fill in the body and click Execute.
Angles API
Once Angles is running, the interactive API documentation is at http://<angles-server>:3000/api-docs. It is served from the server root, not under /rest/api/v1.0. The API is described in OpenAPI 3 format in swagger.json, which you can also open in the Swagger editor.
The main resources are:
| Resource | Purpose |
|---|---|
/team, /environment, /phase |
Reference data a build reports against |
/build |
Test runs, incl. PUT /build/{id}/executions (batch), /keep, /artifacts and /report (HTML report) |
/execution |
Test executions, incl. /history and /platforms |
/screenshot, /baseline |
Screenshots, comparisons, dynamic baselines and image search |
/metrics/phase, /metrics/screenshot |
Aggregated metrics used by the dashboards |
/manual-test-case, /manual-folder, /shared-step, /custom-field, /attachment, /manual-test-run |
Manual test management |
/auth, /users, /settings |
Authentication, users, API tokens, auth and feature settings |
/angles/versions |
Versions of the running instance |
The build and metrics endpoints accept an optional executionType filter (automated or manual). If you leave it out, both are returned.
Client libraries
There are three client libraries. Each provides an AnglesReporter with the same core features:
- JavaScript / TypeScript: angles-javascript-client (npm). The Angles front-end uses it too, and it is the only client with the full manual test management API.
- Java: angles-java-client (Maven), with ready-made integrations for TestNG, JUnit5 and CucumberJVM, plus a Log4j2 appender.
- Python: angles-python-client (pip), with a singleton reporter or independent reporter instances for parallel builds.
Authenticating the clients
All API requests require authentication. Before storing any results, configure the reporter with a personal API token (generated from User Settings → API Tokens). Each client has a setApiKey method (set_api_key in Python), and then sends the token on every request in the x-api-key header.
Batch mode (single request for all executions)
By default the reporter sends each test execution to the Angles API as soon as saveTest() is called. If you enable batch mode with setBatchMode(true), the reporter collects the executions instead. Calling saveAllTests() at the end of the run then stores all of them against the current build in a single request (PUT /build/{buildId}/executions). For large test runs this cuts the number of API calls significantly. The build is still created up-front, and screenshots are still uploaded one at a time as the tests run.
Attachments (logs, HAR files, videos, traces, HTML)
A test can attach files to its results, for the whole test or for one step. Each client has the same four methods (attach_file, attach_data, attach_file_to_last_step and attach_data_to_last_step in Python):
anglesReporter.fail('Order confirmation', 'Order confirmed', 'Payment declined', '');
await anglesReporter.attachDataToLastStep(await page.content(), 'page.html'); // this step
await anglesReporter.attachFile('/path/to/trace.zip');                         // the whole test
await anglesReporter.attachFile('/path/to/network.har');
await anglesReporter.saveTest();
Files are uploaded against the build as soon as you attach them (POST /build/{buildId}/attachment), and linked to the test when it’s saved, so this works in batch mode too. The file extension decides how the UI shows it:
| Extension | Shown as |
|---|---|
.log, .txt |
Text with line numbers and a filter |
.json |
Formatted JSON with a filter |
.har |
A table of requests, with failed ones highlighted |
.webm, .mp4 |
A video player |
.zip with “trace” in the name |
A Playwright trace (download it and open it at trace.playwright.dev) |
other .zip |
A download |
.html, .htm |
The page, with scripts disabled |
.png, .jpg, .jpeg, .gif, .webp |
The image |
The size limit is ANGLES_ATTACHMENT_MAX_SIZE_MB (100 MB by default). Attachments are stored on the same volume as manual-testing attachments.
Execution type
Automated clients never set executionType: builds they create are always automated. Manual runs are created only through the manual test management API, so a manual build on the dashboard always has a real manual run behind it.
Visual testing
Comparing screenshots
Every stored screenshot can be compared against another screenshot, or against the baseline configured for its view and platform. A comparison takes these options:
algorithm:pixel(default): a per-pixel comparison using pixelmatch, which can produce a diff image.ssim: structural similarity, which tolerates small rendering differences. It returns a score in [-1, 1] and can also produce a diff image.phash: a perceptual-hash distance (0–1), for a quick “do these look the same” check. It returns statistics only, with no diff image.
threshold(pixel only, 0–1, default 0.5): the per-pixel colour-distance threshold.regions(pixel only): clusters the changed pixels into bounding boxes, so you can see where a page changed.
Images of different sizes are letterboxed: they are compared over their shared area instead of being stretched, which avoids false differences, e.g. between mobile and desktop. Ignore boxes set on a baseline exclude dynamic areas (dates, adverts, etc.) from the comparison. A dynamic baseline can also be generated from the last n screenshots of a view.
The clients expose the same options through a CompareOptions object on their compare methods.
Finding an image within a screenshot
Next to comparing screenshots, the API can also find a smaller image (the template) within a stored screenshot, using multi-scale template matching. This is useful for checks like “is the logo/button visible on this page”. The clients expose:
findImageInScreenshot(screenshotId, templateScreenshotId, options): searches a screenshot for another stored screenshot.findUploadedImageInScreenshot(screenshotId, templateFilePath, options): uploads a local template image to search for (the template isn’t stored).findImageInScreenshotImage(...): the same search, but it returns the screenshot image with the matched region(s) outlined.
The options let you tune the match:
minConfidence(0–1, default 0.8)scaleMin/scaleMax(the template scale sweep, default 0.75–1.25)maxMatches(1–25, default 1)grayscale(matches on luminance only, which tolerates colour differences between devices better)
The response contains the matched region(s) with their coordinates, confidence score and the scale at which they were found.
Manual test management
Angles 3.0 adds manual test case management next to automated reporting. QAs author versioned test cases per team, execute them in test runs, and see the results in the same dashboards and metrics as automated runs. You find it in the UI under the Manual testing menu (Test cases, Test runs and Shared steps). Admins configure custom fields under Administration → Custom fields.
- Test cases have a title, description, preconditions, tags, steps (action, expected result, test data and image attachments), a priority (
LOW–CRITICAL), a status (DRAFT,ACTIVE,DEPRECATED) and any custom fields configured for the team. You can organise them in a folder tree and clone them. - Versions: every content change creates a new, immutable version. A test run binds each case to the version that was current when the run was created, so an execution always shows exactly what the tester saw, even after later edits. A status change or an edit that changes nothing doesn’t create a new version.
- Shared steps are named, re-usable step sequences. Editing a shared step re-versions every test case that includes it. The UI shows how many cases are affected before you save.
- Custom fields are defined per team and can be text, textarea, number, date, boolean, select, multiselect or user fields. Required fields are only enforced once a case leaves
DRAFT. Deleting a field that is still in use archives it instead, so history stays readable. - Test runs execute a set of cases against an environment and record per-step results and attachments. Each run creates a real build marked as
manual. Per-case results areNOT_RUN,IN_PROGRESS,PASS,FAIL,ERROR,SKIPPEDorBLOCKED(blocked is reported as skipped in the metrics). - Change history records who changed what on every test case, shared step and custom field.
Manual testing is enabled by default. An admin can turn it off from Administration → Settings → Feature Management. Turning it off hides the menus and makes the related API endpoints return 404, but nothing is deleted. Turning it back on restores everything exactly as it was. To ship a new instance with the feature off, set ANGLES_MANUAL_TESTING_ENABLED=false before its first start. This variable is only a seed; after the first start the admin setting is authoritative.
Attachments are written to /app/attachments, so make sure it’s on a persistent volume. The Docker Compose and Kubernetes setups already handle this. If you’re upgrading a large pre-3.0 deployment, you can run node scripts/backfill-execution-type.js to stamp existing builds as automated on disk (they already read back correctly without it).
For the full guide, including permissions and the complete endpoint list, see manual-test-cases.md.
Monitoring with Prometheus & Grafana
Angles can expose a Prometheus scrape endpoint at GET /metrics (served from the server root, not under /rest/api/v1.0). It covers:
- process and host resources (CPU, memory, event-loop lag, disk usage of the screenshot volumes)
- API traffic (request rate, errors and latency per route)
- Angles’ own data (builds, executions, screenshots and baselines by team, environment, status and execution type)
- the health of the metrics pipeline itself.
The endpoint returns 404 until you explicitly enable it, because the output contains team and environment names:
| Variable | Effect |
|---|---|
ANGLES_METRICS_TOKEN |
Requires this token as Authorization: Bearer <token> (or the x-metrics-token header). Recommended. |
ANGLES_METRICS_PUBLIC=true |
Serves the endpoint without authentication. Only use this when the port can’t be reached from outside your network. |
ANGLES_METRICS_CACHE_TTL_MS |
How long database aggregations are cached between scrapes (default 60000). |
ANGLES_METRICS_MAX_SERIES |
Cap on per-team/per-environment series (default 200). |
ANGLES_METRICS_DISK_USAGE=true |
Also walks the screenshot directories to report their file counts and sizes. |
scrape_configs:
  - job_name: angles
    scrape_interval: 30s
    static_configs:
      - targets: ['angles:3000']
    authorization:
      type: Bearer
      credentials: '<ANGLES_METRICS_TOKEN>'
A ready-to-import Grafana dashboard is included. For the full metric list and suggested alerts, see prometheus-metrics.md.
Angles clean-up (cron)
Storing all your test data (and screenshots) without any clean-up can fill up your instance of Angles quickly. That’s why the back-end container runs a nightly cron job (01:00) that uses the build delete API to remove any builds, screenshots and test attachments older than 90 days. To change this number, update the BUILD_CLEAN_UP_AGE_IN_DAYS value in the docker-compose file (or the Kubernetes config) and redeploy.
To keep specific builds, set their “keep” flag (from the UI or with PUT /build/{buildId}/keep). Builds with this flag set aren’t removed by the nightly run, even once they reach the configured age.
NOTE: The clean-up doesn’t remove builds that contain a “baseline” image, so these can still be used for comparisons.
Running Angles locally for development
The back-end
The back-end runs on Node.js 24. By default it connects to the MongoDB set up by Docker Compose (see database.config.js). To point it at another MongoDB instance, set MONGO_URL. The instance must be set up with the right credentials, collections and indexes using mongo-init.js.
# clone the back-end repo, then run:
npm install
MONGO_URL='mongodb://angleshq:%40nglesPassword@127.0.0.1:27017/angles' \
  ANGLES_ADMIN_PASSWORD='<your_admin_password>' \
  LOG_LEVEL=debug node server.js | ./node_modules/.bin/pino-pretty

# run the tests
npm test
NOTE: The code for the Angles back-end is here.
The front-end (UI)
The front-end is a Next.js application that uses the Angles API (provided by the back-end) to retrieve and display the stored test data and screenshots. To run it locally, give it the base URL of the API (e.g. http://127.0.0.1:3000):
# clone the front-end repo, then run:
npm install
PORT=3001 ANGLES_API_BASE_URL=http://127.0.0.1:3000 ANGLES_API_BASE_PATH=/rest/api/v1.0 npm run dev
The styles are written in LESS, and npm run dev / npm run build compile them. All UI text is translated: after adding or changing any text, run npm run check-translations to make sure every language file has the same keys.
NOTE: The code for the Angles front-end is here.
Angles GitHub Pages
The documentation for Angles is at https://angleshq.github.io.